Please note : This help page is not for the latest version of Enterprise Architect. The latest help can be found here.
Profiling Native Applications
Access Analyzer | Profile
Topics
Topic |
Detail |
See also |
||||||
|---|---|---|---|---|---|---|---|---|
Visual Execution Profiler |
The Visual Execution Profiler enables you to quickly report on:
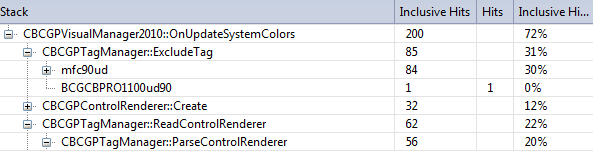
The Profiler only works with MS Native Windows applications, but can be used under WINE (Linux and Mac) to debug standard Windows applications deployed in a WINE environment. The Profiler can generate a report that shows how these functions are called in relation to the application; the following image shows how one function is taking most of the overall time recorded, and how that is broken up into some of the functions that it calls.
|
|
Notes
| • | The Profiler, or sampler, is available in the Enterprise Architect Professional, Corporate, Business and Software Engineering, System Engineering and Ultimate editions |
Learn more
The material ("material" includes all pages, documents and on-line graphics) on this web site is protected by copyright law. (C) 1998-2011 Sparx Systems Pty Ltd.