Please note : This help page is not for the latest version of Enterprise Architect. The latest help can be found here.
Trace Statements
A Trace Statement is a message that is output during execution of a debug session. Trace statements can be defined in Enterprise Architect without requiring any changes to your application source code.
Tracepoint Markers are set in the code editor. Like breakpoints, they are placed on a line of code. When that line of code executes, the Execution Analyzer evaluates and prints the statement either to the Debug window or to file, as configured in the Analyzer script.
Add a Tracepoint Marker
Step |
Action |
See also |
|---|---|---|
1 |
Open the source code to debug in the source code editor. |
|
2 |
Find the appropriate code line, right-click in the left margin and select the Add Tracepoint Marker option. The Breakpoint Properties window is displayed.
|
|
3 |
Ensure the Trace statement checkbox is selected.
|
|
4 |
In the text field below the Trace statement checkbox, type the required Trace statement.
|
|
5 |
Click OK. A Tracepoint Marker is shown in the left margin of the code editor.
|
|
A trace statement can be any freeform text. The value of any variables currently in scope can also be included in a trace statement by prefixing the variable name with a special token. The available tokens are:
| • | $ - when the variable is to be interpreted or printed as a string |
| • | @ - when the variable is a primitive type (int, double, char) |
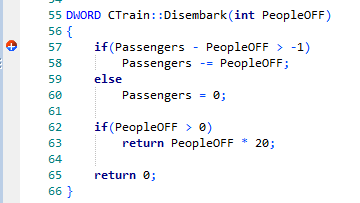
Using the example in the image above, we could output the number of people getting off a train by using the following statement:
There were @Passengers before @PeopleOFF got off the train at $Arriving.Name Station
Notes
| • | Trace statements can be included on any type of breakpoint or marker. |
Learn more
Learning Center topics
| • | (Alt+F1) | Enterprise Architect | Build and Debug | Debug | Add Tracepoint |


