Please note : This help page is not for the latest version of Enterprise Architect. The latest help can be found here.
Profiler Operation
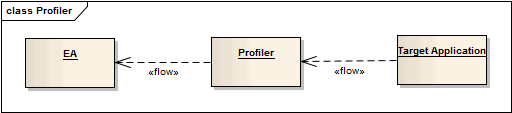
Whenever you launch the Profiler or attach it to a running application, a Profiler process is started. The Profiler operates by taking samples from the target process at intervals of up to 250 milliseconds. At these intervals the Profiler interrupts the process and collects stack information for all threads running at that time; this information is sent back to Enterprise Architect where it is collected, sorted and and stored.
Access Analyzer | Profiler
Actions
Action |
Detail |
See also |
||||||
|---|---|---|---|---|---|---|---|---|
Start a Profiler Process
|
Click on the Run Profiler button on the Profiler window toolbar. |
|
||||||
End a Profiler Process |
The sampler process exits if:
If you stop the Profiler and the process is still running, you can quickly attach to it again.
|
|
||||||
Pause and resume a session |
You can pause and resume profile sample collection at any time during a session. When sampling is turned on or resumed, the Profiler process becomes active and samples are collected from the target; resuming sampling collects completely new samples. The Profiler process idles if sampling is turned off or paused during a session. The Report and Discard Data buttons then become enabled.
|
|||||||
Generate report |
Click on the Report button to display the Profiler report. Having reviewed this report, you can also generate from it a report on the execution of an individual function. |
Generate, Save and Load Profile Reports
|
||||||
Clear results |
You can clear any sample data collected for the target application and begin again - click on the Discard Data button to discard the samples currently collected in the Profiler window.
|
|


